Project in collaboration with Astrid Mathilde Boberg, Jens Martin Norheim Berget and Mads Severin Murvold for Fremtind Forsikring
During the summer of 2024, I worked as an intern for Fremtind Forsikring for seven weeks. Our team consisted of four people, two developers and two designers. We were asked to develop a web application to visualize, understand and be able to change specifications of an insurance product. The main users of the application were employees at Fremtind, specifically functional architects, developers and product managers.
During the project I facilitated workshops for idea generation through flowcharts, wire framing and facilitated user-testing. In addition I worked with information visualization in Figma and application prototyping.
In the videos below you can see how editing a product was done before, and how it is done in the application we developed. (The videos are partially blurred to hide product specifications).
The process of viewing and editing a product was done with an excel-file with over 100 rows and 100 columns. To change specifications the functional architect did changes in excel and sent screenshots to the system manager who manually created an SQL. The whole process was difficult and time consuming.
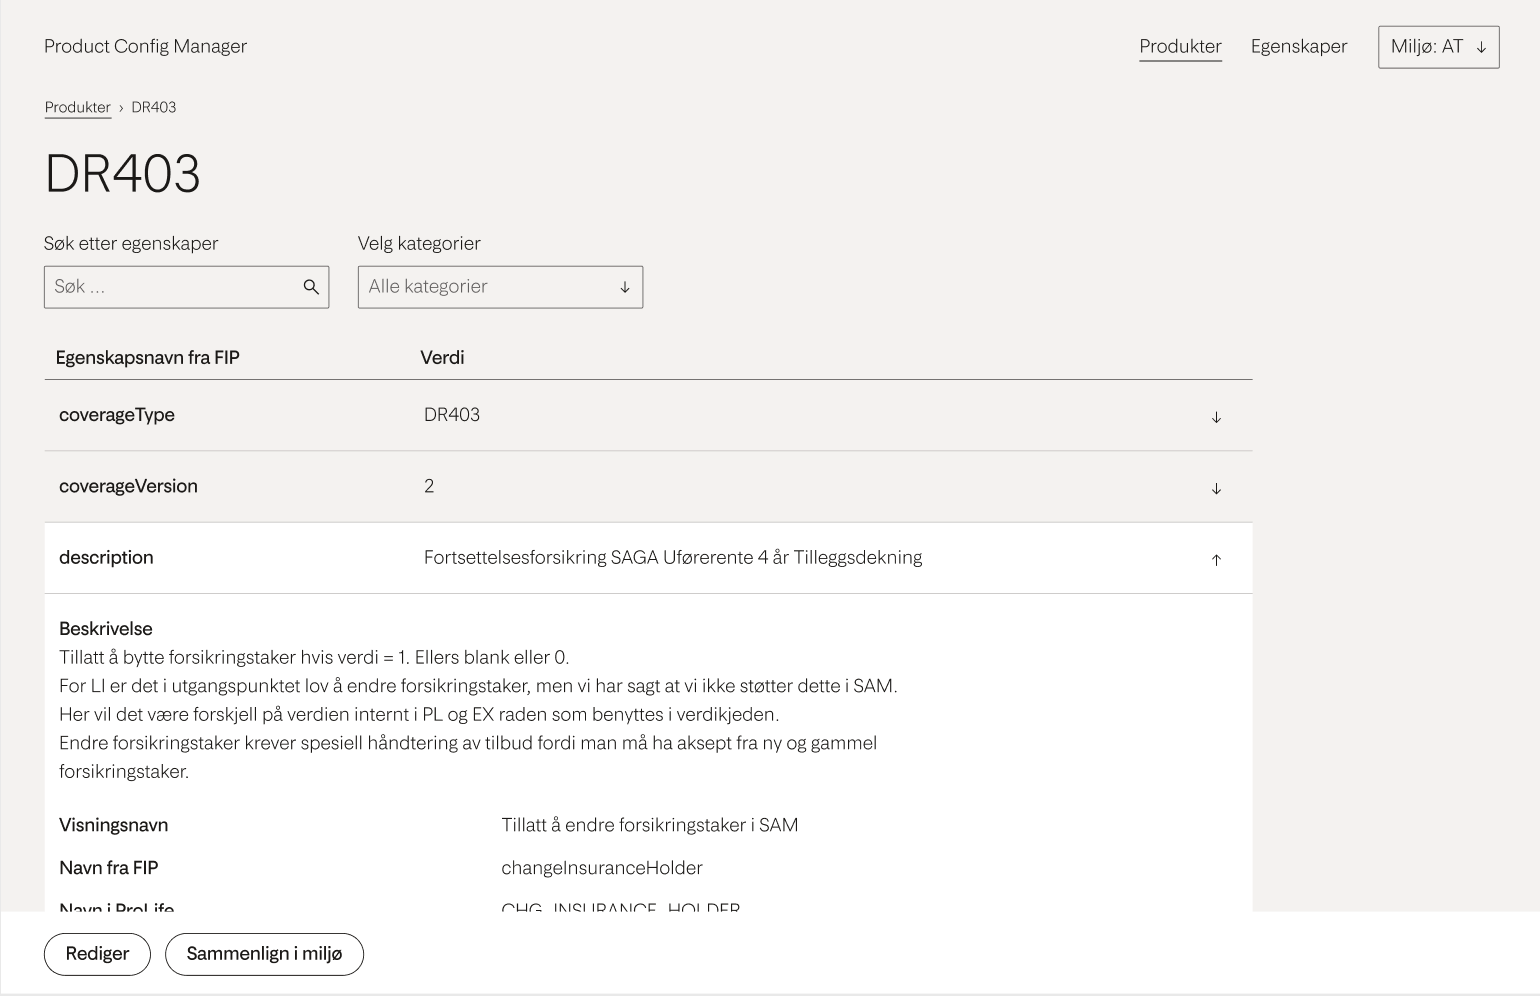
In the application we developed the user can easily search for the product they want and see all relevant specifications. Filtering makes it easy to exclude information that is not needed. The information of each product is visualized in a clear manner, reducing the risk of error. When making changes to a product an SQL is automatically generated,
We did a workshop to develop flowcharts based on our users typical tasks
The process
We started by going through the requirement specification and looking at examples of tasks that the application will be used for. Based on this our team prioritized which functions was absolutely necessary and other functions that would be nice to include if possible.
I facilitated a workshop to develop flowcharts for the website based on relevant tasks. After finishing the workshop, we (designers) combined the flowcharts to create a flow for the entire application.
Based on the flowcharts, I facilitated a workshop to brainstorm and develop wireframes. Then, we (designers) combined the results and made a paper prototype, with some variations, that we tested in our primary user.
We prototyped on post-it-notes. This made it easy to change layouts and test different variations with the user.
Prototyping on post-its made it easy to adjust the layout and test different variations
We prototyped sections of the website, tested and iterated to be able to deliver some finished sketched to the developers while the design was still in process. After prototyping all the pages, we were able to test the flow and different alternatives on users.
After testing the paper-wireframes we started working with the prototype in Figma. From wireframing and testing we had concluded on the basic architecture and structure of the web application. Therefore the developers could set up the navigation and basic functions for the different pages before receiving finished Figma-prototypes.
We worked with sections of the website, tested them, got feedback and iterated before moving on to other pages. This was to ensure that we could deliver pages to the developers and avoid a big delay on the development compared to the design (Figma-prototype).
After prototyping and testing the pages separately, we were able to do tests on the complete flow with users. Some pages had alternative flows that we tested to find the best solution for typical user tasks. We also had a fun programming session with the whole team to fix small errors with the application.
The solution
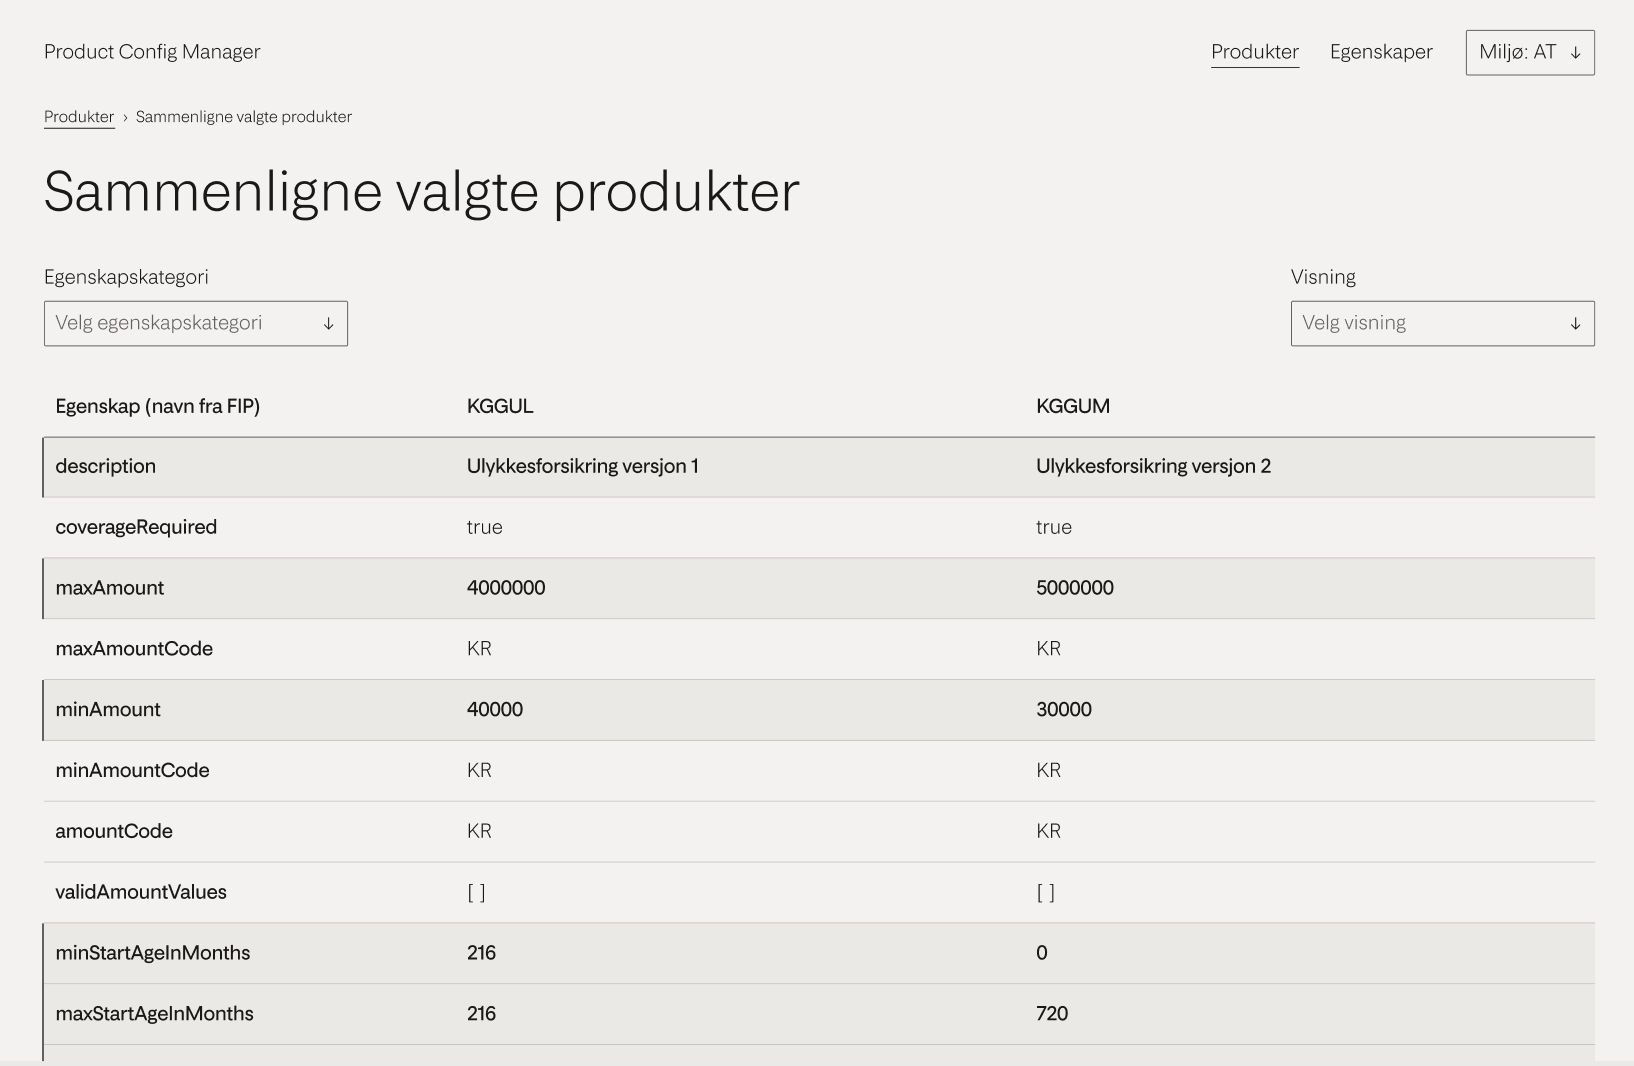
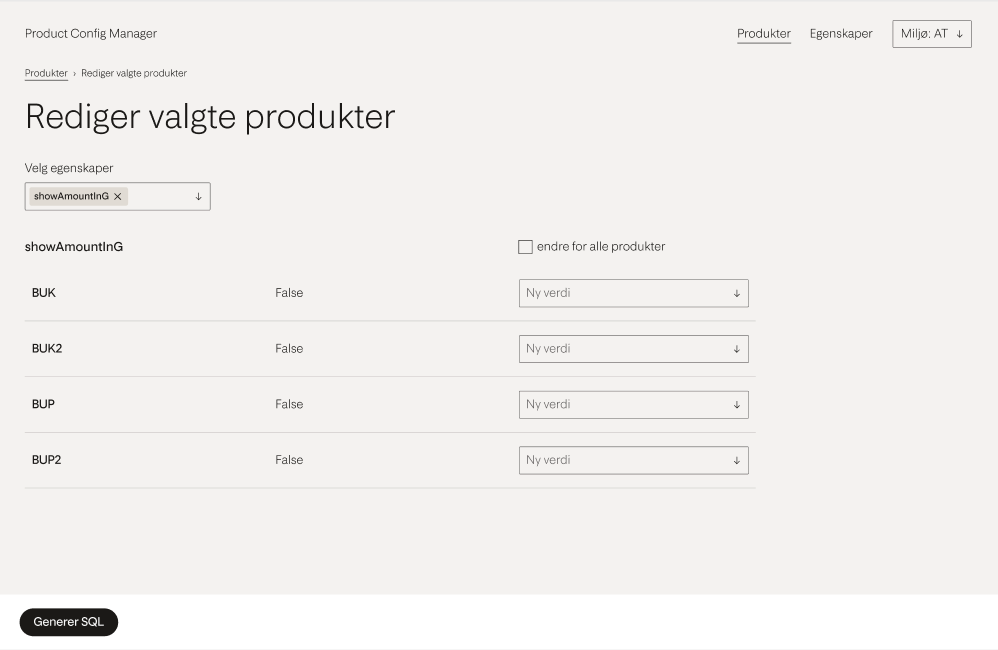
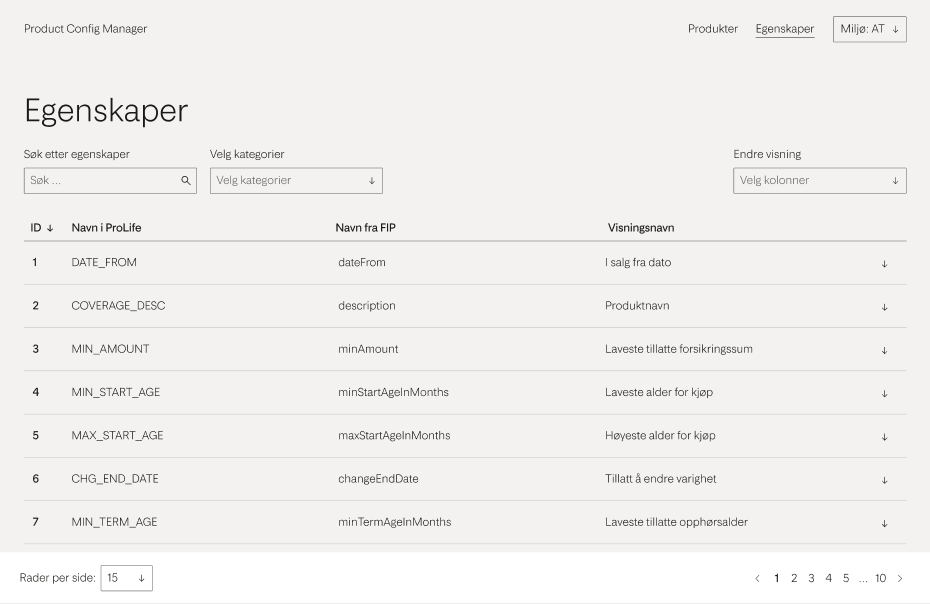
The result of our work was an application displaying all private insurance products that Fremtind deliver. Every product has a page showing its specifications (so-called properties). The user can edit the properties and automatically generate a SQL. It is possible to compare similar products as well as to compare one product in different testing environments. The user can edit several products at the same time. Lastly there is a page displaying all properties with names and explanations, that can be edited if necessary.


Takeaways
This was a fun and challenging project. When designing, one of the challenges was to display all the information clearly when the starting point was an 100row-100column excel-file. As always, when working in a team, we were challenged in collaboration. In this project, I believe that it was important that the whole team contributed in defining the requirements, brainstorming and developing the flowchart and wireframes. By doing this all team members had ownership to the product and it was easier to discuss issues later on.
I got a lot of practice in explaining the choices I made. We made a lot of decisions, based on user testing, standards, previous knowledge etc. The developers in our team were eager to ask questions about the design. Often I was able to explain the reasoning and it lead to agreement. Sometimes we did extra testing, or brought in others to get more feedback. There were also instances with technical issues we did not uncover before development, and we had to create alternatives.